This post aims to show you how closely each statistical category we use is related to where we end up in the final regular season standings. To do this, I complied the standings for all five years that we've played and laid out a table that shows how each spot in the standings related to the rank of each stat category when the season ended. All the data you see below is taken from all five years of this league where I ranked each team per season and stacked that against where they ranked for each statistical category. I'll take you through each of the categories to see what stats are important to ranking high in our standings and what stats might not relate as strongly as we would assume. The individual stat tables will show you the Season Rank set alongside the corresponding rank for that statistic. At the bottom of these small tables, you'll see a total correlation coefficient that will show you the strength of the standings rank and the statistical rank. Positive 1 is the strongest possible relationship and -1 is the weakest possible relationship. So for example, if the top ranked team was also ranked #1 in runs scored, that relationship is 1. If the top team was ranked 12th in home runs, that relationship is -1. There's a lot of little tables to cover so I'll try to get to it now and be quick with summarizing every category.
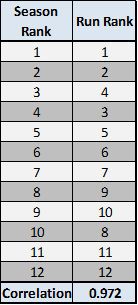
We'll start with the hitting categories and actually lead with the stat that is most closely related to regular season success. You can see that the top ranked teams usually rank high in runs scored and the low teams rank low in runs scored as well. This creates a .972 correlation coefficient, which is a very strong number. Runs scored is a product of a lot of things. Batting average, home runs, and stolen bases so you can see the better your players are at the basic hitting and running skills, the more runs they will score and this seems to help owners move up in the standings as well.
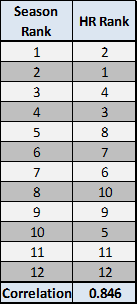
Home runs are becoming more rare in major league baseball and if you can find a legit power source, the higher you can climb in the standings. This isn't as strong of a relationship as runs scored but still a pretty important piece to regular season success.
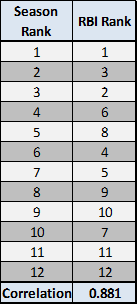
Having RBI guys is important to ranking high in the standings but less so than runs and homers based on what we've seen so far.
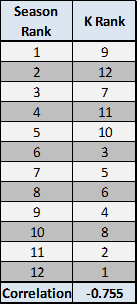
Here's where it gets a little tricky. You'll see a negative relationship between season rank and batting K's, which might sound wrong to you. This leads me to believe that maybe the higher ranked teams are filling out their lineups more and accumulating more batting K's than the bottom teams that might not make sure that they have active players on their rosters every day. So based off of this, you shouldn't be overly concerned if you're trying to win a title and your guys are striking out a fair amount because chances are, so are the rest of the top teams in our league.

This surprised me a little as I didn't think stolen bases would be this strongly related to regular season success.
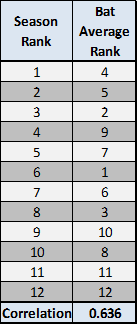
Everyone wants players that hit the ball and get on base. It's basic baseball but it's also not overly important to have a high team batting average in order to defeat your opponent. It's certainly nice to have a high batting average and having a bottom team average sure looks like it will sink your chances but the relationship isn't as strong as you might think.
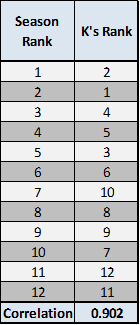
We move to the mound to see what pitching stats have led to regular season success and this is the strongest relationship of them all. Having a bunch of strikeout pitchers is a nice place to start but accumulating strikeouts is also due to an owner that is streaming pitchers occasionally to his advantage. You might not get a QS or a minuscule ERA but chances are you will get some K help no matter what. You could and should argue that the active owners are also filling out their rosters more than inactive owners, which again is why this relationship is so strong.
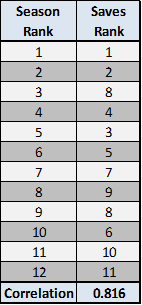
I was also a bit surprised to see saves relate so closely to regular season success but we can touch on the active owner argument again as an owner that is constantly checking his roster and free agent options is more likely to have a set of actual MLB closers on their roster. It's not always such a strong correlation as the third place team doesn't always rack up the saves while the 10th place team has some nice closers on occasion, too.
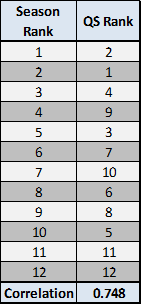
You can poke holes in this stat research if you want, and with the small sample size, I certainly wouldn't put up much resistance but we're seeing a definite relationship between accumulation of counting stats and highly ranked teams. The same goes with Quality Starts as the top teams are generally good at drafting quality pitchers, streaming quality starts, or both.
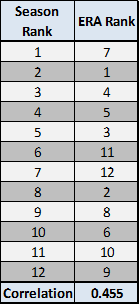
Our fourth strongest pitching rank relationship is ERA and it's really not a strong relationship at all. Of course you want guys that prevent runs but it doesn't appear that a pitching staff full of low ERA guys will lead your team to the top of the standings.
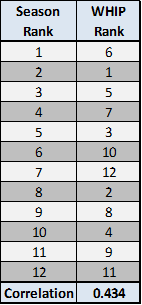
The WHIP correlation is slightly weaker than the ERA relationship but is pretty close. ERA and WHIP generally go hand in hand so you would expect this stat to be very similar to the ERA stat in terms of rank relationship.
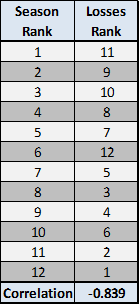
Racking up losses isn't a good thing, as you know, but it also doesn't seem to drag the top teams down. The top teams actually have much more losses than the bottom teams and that's because the top teams are the active teams that are looking to exploit favorable pitching matchups constantly. Sometimes your streaming pitcher gets the loss but he also helped get some more K's and hopefully helped in the ERA, WHIP, and QS stats as well.
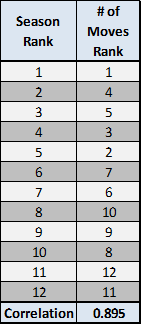
This table played out pretty predictably as the active teams are usually the better teams in fantasy baseball. This data is slightly misleading because at the end of the year you can bet the teams that are out of the playoff hunt don't make hardly any moves while the top teams that are advancing are making more moves than any of the teams that have been eliminated, which is skewing the data a little bit. Either way, we can all agree that an owner that is making moves is also an owner that is making the playoffs.
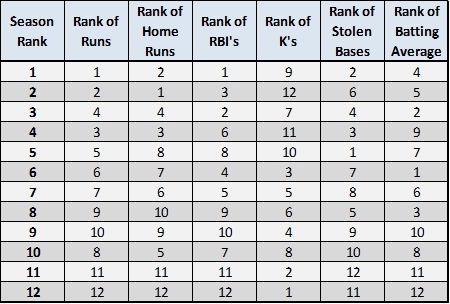
Here are all the batting ranks lumped together for your viewing pleasure.
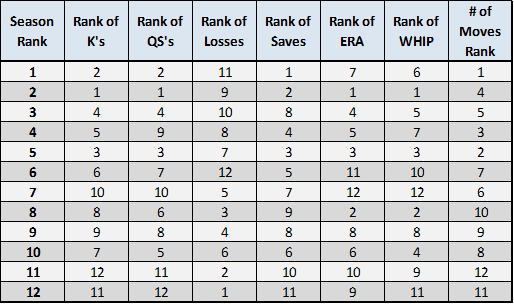
And here's the pitching ranks.
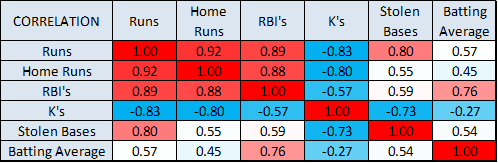
Above is a little heat map that shows the correlation strength for all the batting stats. As you can guess, the red numbers are strongly related and the blue numbers have the weakest relationship.
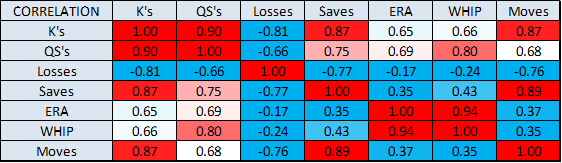
And here's the pitching rank heat map.
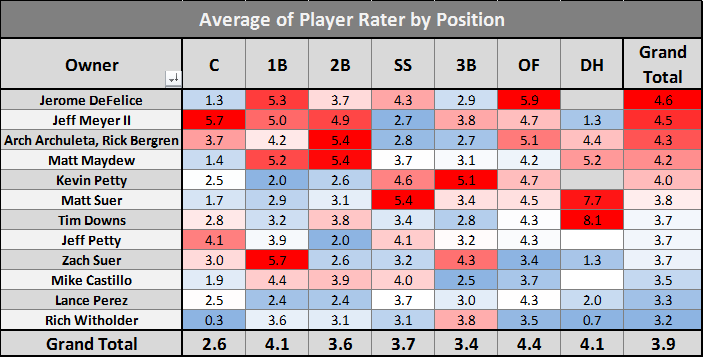
To wrap this up, lets take a look at each owner and the player rater numbers they've earned from each position. The number associated with each position is the average player rater number you received at the end of the year from that spot. This data isn't perfect because we're only using the players on your roster at the end of the season but I thought it was still a little interesting to see the positions that each owner has had success in over the years. Outfielders have given us the most player rater value on average while the catching position brings the smallest offensive numbers, as you might've predicted.
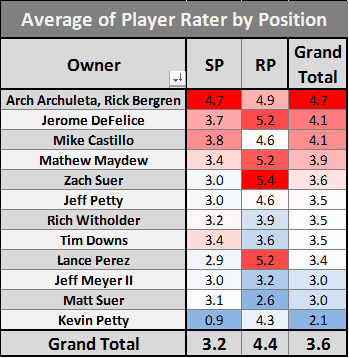
And here's the pitching player rater stats. Again, it's not perfect data and Kevin would likely rank higher if we took the totals from the each and every player he had on his team throughout the year but unfortunately ESPN can only provide player rater numbers for the end of the season roster when I collect this data. Arch and Rick are surprising nobody by being ranked the highest on average.
Well, that's it for the stat correlation post. I hope it was somewhat enlightening to see how the top teams rank in each category and also see which categories have been important or not for our top and bottom ranked teams. Hopefully all these numbers and colors doesn't equal to a high correlation of your brain and a headache after reading this.
Well, that's it for the stat correlation post. I hope it was somewhat enlightening to see how the top teams rank in each category and also see which categories have been important or not for our top and bottom ranked teams. Hopefully all these numbers and colors doesn't equal to a high correlation of your brain and a headache after reading this.
